Graph-based Visualization of Topic Shifts
This graph visualization is a result of a research project at the Chair for Bioinformatics and Information Mining at the University of Konstanz to investigate the visual exploration of topic shifts. If you are interested in a more detailed description about the background and methods used, you may want to have a look at the referring paper(PDF).
The abtracts of the IEEE SMC A, B, and C transactions from 1996 to 2006 were used as input data.
These abstracts were parsed and tokenized. Then the tokens were assigned a part-of-speech (POS) tag, using the Penn Treebank POS tag set. After excluding the stop words like “and”, “or”, “the” and so on, the terms were stemmed: reduced to their stem, in order to avoid having different terms for different flexions, conjugations or declensions. Finally, the most relevant terms according to the tfidf measure were extracted. The threshold was chosen to have roughly two terms per document extracted, in total 5000 terms.
At the end the data consists of years and terms related to years, where a link means that the term occurred in the year represented by the destination node. Thus, the links are directed. Since the nodes had no type, I used a hub-authority approach to distinguish between years and terms. Nodes with many incoming connections are years and nodes with no incoming connections are terms.
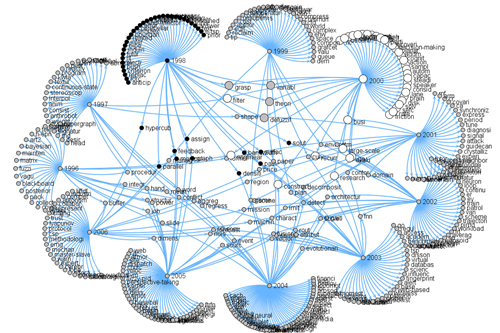
The years are positioned on a shell around the center. Terms which only occur in one particular year are grouped outside this shell in a circle around the year.
Terms which occur in several years are placed inside the shell, and they are pulled towards the referring years. Hence, they will come to an equilibrium in the geometric middle of the referring year nodes.
The years are ordered clockwise from old to new starting at 9 o'clock, which leads to some interesting properties of this visualization:
- In the center are those terms which occurred in two years with a five-years distance (since there are 10 years, hence, five years are the greatest distance, which results in a geometric middle in the center).
- The more the terms are towards the shell, the closer are the years they occurred in. Exception is the gap between 1996 and 2006 at 9 o' clock.
- The terms which occur in the earlier and in the latest years are on the left side of the middle area.
- Terms occurring between 1999 and 2004 are on the right side, between 2002 and 2006 at the bottom, between 1997 and 2001 at the top, respectively.
You may click on to image to find a larger version of the image.

Color was used to additionally distinguish the terms according to the years they occurred in. Nodes could be negative or positive or neutral. In the picture above 1996 and 1997 are positive (white), the most recent years 2006, 2005 , and 2004 are negative (black) and the years in between are neutral (gray). All terms inherit the color from their connected years. If a term is connected to a positive and a negative year it becomes neutral. In all other cases positive or negative are stronger than neutral. One can immediately identify the younger (black) and older (white) terms.
Another visual variable – the size – was used. At the image at the very top one can see, that the year 2000 is selected. The nodes of the selected year and of all terms connected to this year are increased in size, making it comfortable to explore the visualization for terms occurring in certain years.
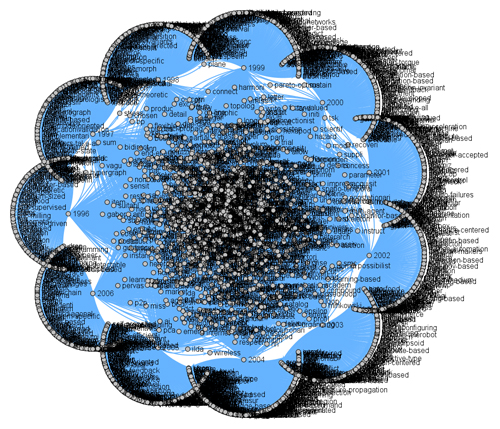
And this is how the visualization looks like, if too many terms are displayed: visual clutter with the beauty of a flower.
Hi, Thanks for this...
Hi,
Thanks for this...
Post new comment