Archive - Feb 2008
February 27th
Tooltips for Google Chart API
As described in the article "A five dimensional scatterplot" it is only possible to display three dimensions with Google's chart API: x, y and size of the dots. In order to provide more information to the reader of the chart, tooltips are the solution at hand.
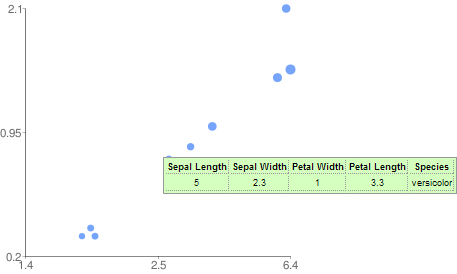
A 5-Dimensional Scatter Plot
Sometimes the concept of dimensionality in plots is misunderstood. A scatter plot can not only display two dimensions (I'm not talking about a 3D scatter plot) but up to five or more.

Dimensions in visualizations are not necessary orthogonal spatial dimensions. With visual attributes such as color, size and shape one can easily add some more dimensions to a visualization. In the following I will discuss some of the advantages and problems of such an approach.
February 10th
Travel Information Visualization
The amount of information we consume every day is continuously growing. Because of that, it is important to ease the consumption of information in everyday life. Bus and train schedules are certainly an important information - especially if you are in a foreign city and common ways of presenting this information leave room for improvement.
Thus, this article reviews some of the existing ways how bus and train schedules are presented. Some not so common approaches are shown as well. And finally, some of the better ones are redesigned.

All examples are adapted to the bus lines in Konstanz, Germany.
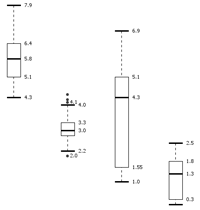
February 4th
Box Plot