Archive - Jan 2008
January 26th
Bubbles: Built with Processing
This is a completely useless processing play-around. But it looks nice, at least in my opinion. So click on the image below, lean back, watch it, and enjoy.

January 21st
Graph-based Visualization of Topic Shifts
This graph visualization is a result of a research project at the Chair for Bioinformatics and Information Mining at the University of Konstanz to investigate the visual exploration of topic shifts. If you are interested in a more detailed description about the background and methods used, you may want to have a look at the referring paper(PDF).

The abtracts of the IEEE SMC A, B, and C transactions from 1996 to 2006 were used as input data.
January 10th
KNIME Interactive Views
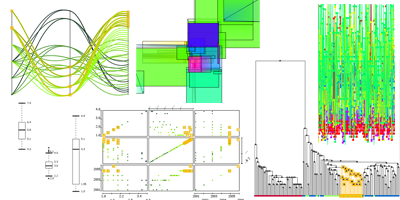
One of my responsibilities at KNIME is the design and implementation of interactive views.

KNIME, pronounced [naim], is a modular data exploration platform that allows the user to visually create data flows (often referred to as pipelines).
This article should shortly introduce the views I developed so far and some which are still under construction. I describe the following views:
each with a screenshot and how the information is displayed in each visualization.
k-Means and Voronoi Tesselation: Built with Processing
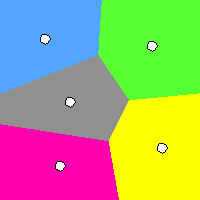
This is a small animation of how one of the best known cluster algorithm - the k-Means - works, and how it is related to the voronoi tesselation.
