Archive - Jan 21, 2008
Graph-based Visualization of Topic Shifts
This graph visualization is a result of a research project at the Chair for Bioinformatics and Information Mining at the University of Konstanz to investigate the visual exploration of topic shifts. If you are interested in a more detailed description about the background and methods used, you may want to have a look at the referring paper(PDF).
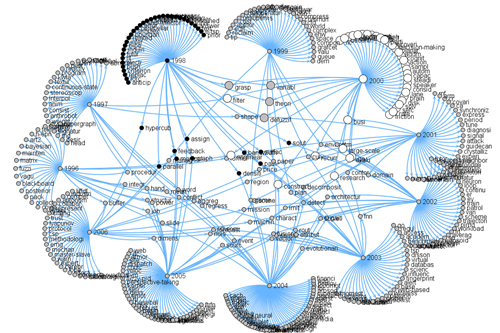
The abtracts of the IEEE SMC A, B, and C transactions from 1996 to 2006 were used as input data.