Archive - Jan 9, 2008
KNIME Interactive Views
One of my responsibilities at KNIME is the design and implementation of interactive views.
KNIME, pronounced [naim], is a modular data exploration platform that allows the user to visually create data flows (often referred to as pipelines).
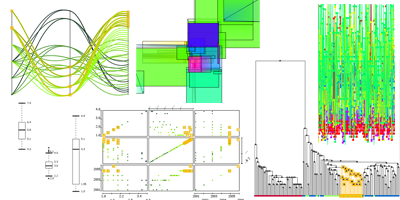
This article should shortly introduce the views I developed so far and some which are still under construction. I describe the following views:
each with a screenshot and how the information is displayed in each visualization.
k-Means and Voronoi Tesselation: Built with Processing
This is a small animation of how one of the best known cluster algorithm - the k-Means - works, and how it is related to the voronoi tesselation.
