Archive - Jun 2008
June 8th
Parallel Coordinates and Missing Values
This article describes how parallel coordinates can be used to get an overview over the distribution of missing values in the data.
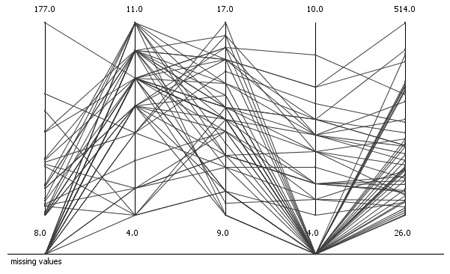
When analyzing data, it is almost always the first step to get an overview and understand the data, its properties, distribution and pitfalls. In order to achieve this, usually the data is visualized. There are several views available for this task. However, all of these views lack the support of missing values. Missing values cannot be displayed per definition, since they are missing. Nevertheless, they also provide useful information when trying to understand the data. As far as I know there are two possibilities to display missing values: histograms (pie charts) and parallel coordinates.