Archive - Feb 26, 2008
Tooltips for Google Chart API
As described in the article "A five dimensional scatterplot" it is only possible to display three dimensions with Google's chart API: x, y and size of the dots. In order to provide more information to the reader of the chart, tooltips are the solution at hand.
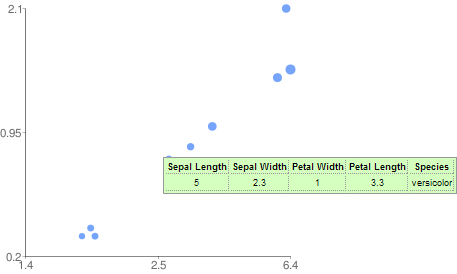
A 5-Dimensional Scatter Plot
Sometimes the concept of dimensionality in plots is misunderstood. A scatter plot can not only display two dimensions (I'm not talking about a 3D scatter plot) but up to five or more.

Dimensions in visualizations are not necessary orthogonal spatial dimensions. With visual attributes such as color, size and shape one can easily add some more dimensions to a visualization. In the following I will discuss some of the advantages and problems of such an approach.